Topadial has sophisticated inbound queueing capabilities, and the reports to go with it…
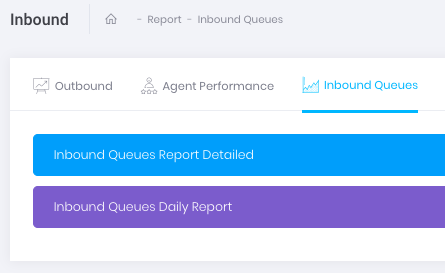
Inbound Queues Report Detailed

This report can be filtered by date and inbound queue, if you do not filter a queue it will give the totals and averages of all inbound queues
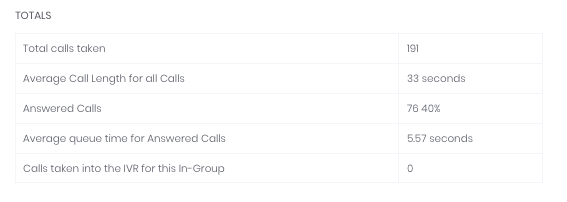
Totals

Total Calls Taken – This is the total inbound calls which entered this queue during the date filter specified and within the queues filtered
Average Call Length for all Calls – This is the average call length for all calls including calls which hungup before connecting to a agent
Answered Calls – This is the number of calls answered by a agent
Average Queue time – Of all calls which rang the queue, the average queue time, this includes calls which connected immediately to a agent
Drop Detail

Total Drop Calls – This is the total number of dropped calls (customer hungup before connecting to a agent)
Drop/Answered – Is the ratio between drops vs answered calls expressed as a percentage, in this queue we dropped 77 and answered 76 calls, so the drop/answered % is 101%
Average hold time for Drop calls – This is the average amount of time the customer took before they hungup before connecting to a agent and is a good indication of the customers tolerance to wait in a queue for this call
Queue Stats

Total Calls That Entered Queue – This is the number of calls that did NOT go straight to a agent, (52% waited on hold in the queue)
Average Queue Length for queue calls – The average amount of time customers waited in the queue of the customers who did not go straight through to a agent and had to wait on hold
Average Queue Length across all calls – This is the average hold time of every call which rang this queue, in this case of all 191 calls
Call Hold Time Breakdown in Seconds

This is a visual indicator of how many calls were on hold and for how long, regardless of if they answered or dropped
Call Drop Time Breakdown in Seconds

This is a visual indicator of how many calls dropped and after how long
Call Answered Time and Percent Breakdown in Seconds

Another visual aid to determine of the calls which were answered, after how long where they answered e.g. 3 calls (2%) were answered between 15-19 seconds (15 column)
This also features a cumulative total, e.g. 68 calls (36%) were answered between 15-19 seconds (15 column)
Call Status Stats
Here we have all of the statuses set by the agents from the calls they have taken in these filtered queues

Agent Stats

This shows how many calls each agent took, total talk time and average talk time
Call Initial Queue Position Breakdown

This is the call positions the customers entered when entering the queue, we can see 180 customers entered in the queue at queue position 1 (they were the only ones waiting), and 11 entered the queue in queue position 2 (there was 1 customer ahead of them).
Time Statistics

This is a graphical representation of how many inbound calls and dropped calls there was, you can scroll along the graph to zoom in on individual areas. It is in 15 minute increments

Here we have scrolled to view a certain timeframe
Call Answered Time Breakdown

This is a detailed breakdown of how many calls were answered after what amount of hold time, within specific times

For example here we can see that on the 1300 line (1pm-1:14pm) 1 call was answered in the first column (0 seconds), 1 call was answered in the second column (within 5 seconds) and 1 call was answered in the third column
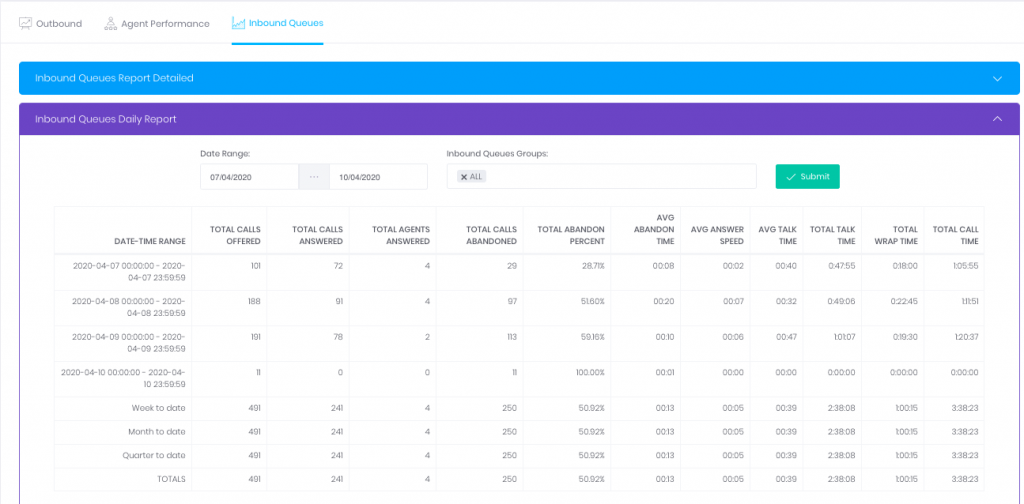
Inbound Queues Daily Report

This report is also available in the inbound queues tab
You can filter by date or Inbound Queue
You can compare day by day the performance of your call queues
Total Calls Offered – This is the total number of calls which entered the queue (including calls which were answered immeditely)
Total Calls Answered – This is the total number of calls answered by a agent
Total Calls Abandoned – This is the total number of calls dropped (customer hungup before the agent answered)
Average Abandon Time – This is the average amount of time a customer waits before hanging up before connecting to a agent
Total Abandon Percent – This is the % of customers which hungup before connecting to a agent
Average Answer Speed – This is the average amount of time a customer would wait in the queue before connecting to an agent
Average Talk Time – This is the average amount of time a answered call lasted
Total Talk Time – This is the combined total of all agents talk time from calls in this filtered queue
Total Wrap Time – This is the combined total of all agents “disposition” time updating crm and call notes and statuses
